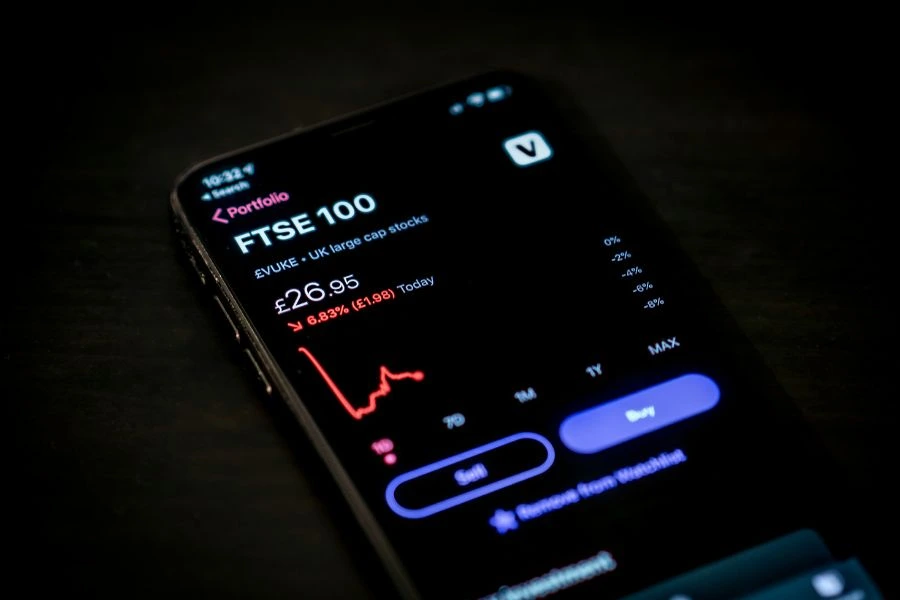
So, you’ve bought some crypto or you’re thinking about it, but when you open a trading platform, it looks like a spaceship dashboard. Don’t worry—you’re not alone. Crypto charts might seem intimidating at first, but once you understand the basics like candlesticks, support/resistance, and trends, you’ll be reading charts like a seasoned trader.
This beginner-friendly guide breaks down how to read crypto charts step by step, enabling you to better understand market movements and make more informed decisions.
Table of Contents
Why Reading Crypto Charts Even Matters
Crypto is volatile—and price swings can happen within minutes. Understanding how to read crypto charts gives you an edge. It allows you to:
- Spot potential buying or selling opportunities.
- Recognize market patterns before others do.
- Avoid panic-selling during normal corrections.
In short, charts are your eyes in the trading battlefield.
The Anatomy of a Crypto Chart
At its core, a crypto chart is just a visual representation of price over time. Most platforms allow you to toggle between different time frames (1 minute, 5 minutes, 1 hour, daily, or weekly) and display types (line, bar, or candlestick).
Line charts show the closing price over time—simple, but not super detailed.
Bar and candlestick charts offer more info like open, high, low, and close prices. For that reason, most traders prefer candlesticks.
Also Read: What Is an Oracle in Crypto and Why Smart Contracts Rely on Them
Candlesticks: The Language of Traders
The candlestick is the building block of crypto chart reading. Here’s how it works:
- Body: The thick part shows the opening and closing prices.
- If the candle is green (or white), the price closed higher than it opened—bullish.
- If it’s red (or black), it closed lower—bearish.
- Wicks (or shadows): The thin lines above and below the body show the highest and lowest prices reached during that period.
Each candlestick tells a mini story about who was in control—buyers or sellers—during that time frame.
Recognizing Common Candlestick Patterns
You don’t need to memorize dozens of patterns, but a few basics go a long way:
- Doji: When the opening and closing prices are almost the same. It signals indecision in the market.
- Hammer: A small body with a long lower wick. Often appears at the bottom of a downtrend, signaling potential reversal.
- Engulfing: When a candle fully “engulfs” the previous one. Bullish engulfing = price might rise. Bearish = might fall.
These are just indicators, not guarantees, but they’re helpful to keep an eye on.
Understanding Support and Resistance Levels
Support and resistance are price levels where an asset tends to stop and reverse.
- Support: A price level where buying interest is strong enough to prevent further decline. Think of it as a price floor.
- Resistance: A level where selling pressure overcomes buyers and the price struggles to rise above. Like a price ceiling.
If a coin keeps bouncing off $30, that’s likely a support level. If it keeps failing to break past $50, that’s resistance.
Breakouts (price smashing through resistance) or breakdowns (price falling below support) often signal big upcoming moves.
Spotting Trends: Up, Down, and Sideways
Trends are the direction the market is moving in:
- Uptrend: Higher highs and higher lows. Good time to consider buying.
- Downtrend: Lower highs and lower lows. Might want to be cautious or sell.
- Sideways/Range-bound: Price bounces between support and resistance. Traders often buy at support and sell at resistance.
Drawing trendlines helps visualize these movements, and tools like moving averages can confirm trends.
Also Read: What Is Crypto Staking? Benefits, Risks & Platforms to Know
Volume: The Unsung Hero of Crypto Charts
Volume tells you how much of a coin was traded during a period. High volume means strong interest and confirms the strength of a price move.
For example, if Bitcoin breaks through a resistance level with high volume, the move is more likely to stick.
Low volume breakouts? Often fake-outs. Always check volume alongside price action.
Charting Tools and Platforms You Can Use
Some popular platforms for crypto charting include:
- TradingView – Offers real-time data and loads of indicators.
- CoinMarketCap & CoinGecko – Simple charts for glances.
- Binance / Coinbase Pro / Kraken – Exchange-based charts with live trading features.
If you’re new, start with TradingView’s free version—it’s beginner-friendly and powerful.
A Word of Caution: Don’t Rely on Charts Alone
Charts are great tools, but they’re not fortune tellers. Use them with other info:
- Follow the news (regulations, hacks, ETF approvals).
- Check on-chain metrics (active addresses, transaction volume).
- Be mindful of sentiment indicators like the Fear & Greed Index.
And above all: manage your risk. Charts won’t protect you from poor money management.
Final Thoughts
Learning how to read crypto charts isn’t just for pro traders or day traders—it’s essential for anyone serious about understanding the market. Start with candlesticks, understand support/resistance, watch trends and volume, and with practice, these patterns will become second nature.
You don’t need to predict every move. You just need to read the signs better than most—and that’s what good chart reading is all about.


